A1C Levels Printable Chart and Tracker
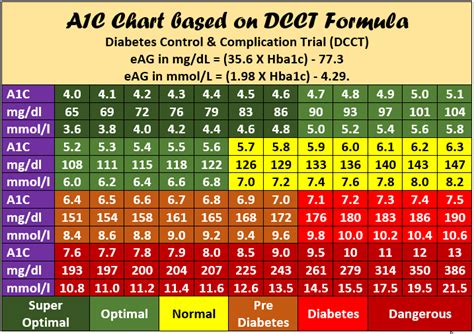
Understanding A1C Levels: A Comprehensive Guide

Managing diabetes requires regular monitoring of blood sugar levels, and one of the most important metrics is the A1C level. A1C, also known as glycated hemoglobin, is a measure of average blood glucose levels over the past 2-3 months. It provides a comprehensive picture of blood sugar control and is a crucial indicator of diabetes management. In this article, we will discuss the importance of A1C levels, how to interpret them, and provide a printable chart and tracker to help you monitor your levels.
What is A1C?
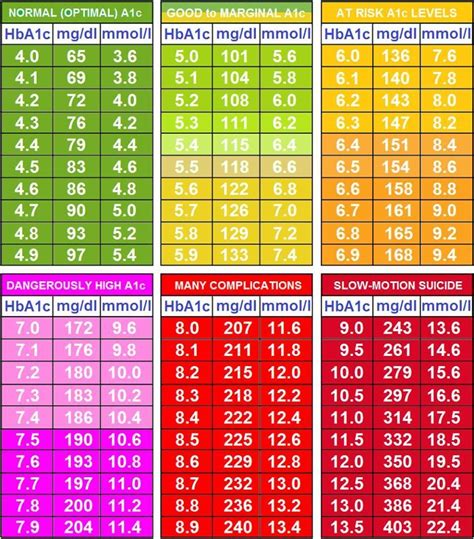
A1C is a type of hemoglobin that is bound to glucose. It is formed when glucose in the blood attaches to hemoglobin in red blood cells. The A1C test measures the percentage of hemoglobin that has glucose attached to it, which indicates the average blood glucose levels over the past 2-3 months.
Why is A1C Important?
A1C is an essential metric for managing diabetes because it:
- Provides a comprehensive picture of blood sugar control over an extended period
- Helps identify patterns and trends in blood glucose levels
- Assists in adjusting treatment plans to achieve optimal blood sugar control
- Reduces the risk of diabetes-related complications, such as heart disease, kidney disease, and nerve damage
Interpreting A1C Levels
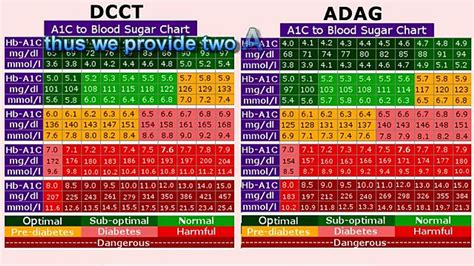
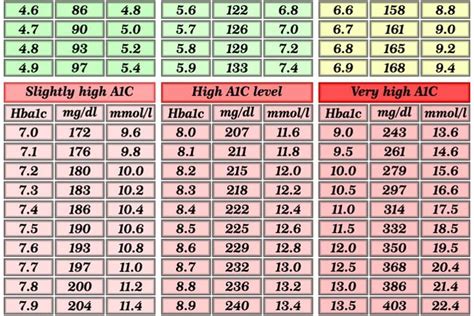
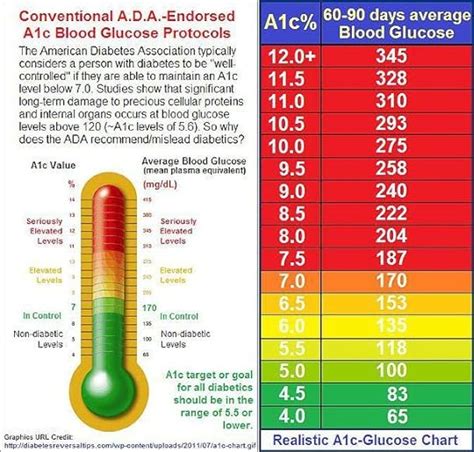
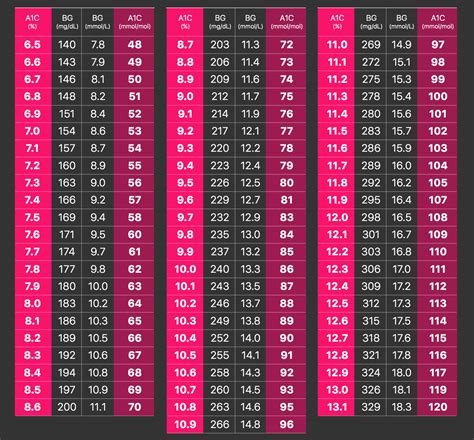
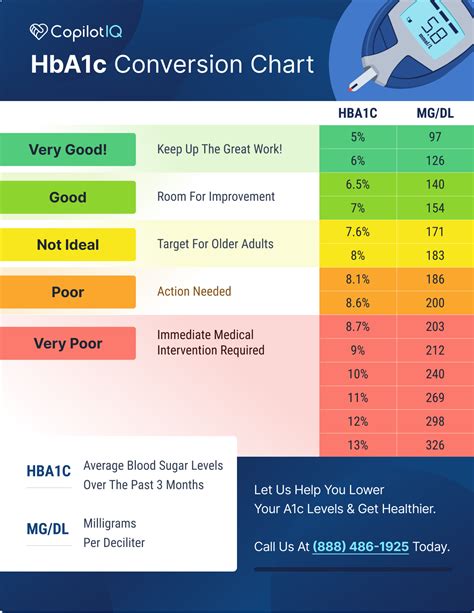
A1C levels are measured as a percentage, and the American Diabetes Association (ADA) recommends the following ranges:
| A1C Level | Interpretation |
|---|---|
| < 5.7% | Normal |
| 5.7% - 6.4% | Prediabetes |
| ≥ 6.5% | Diabetes |
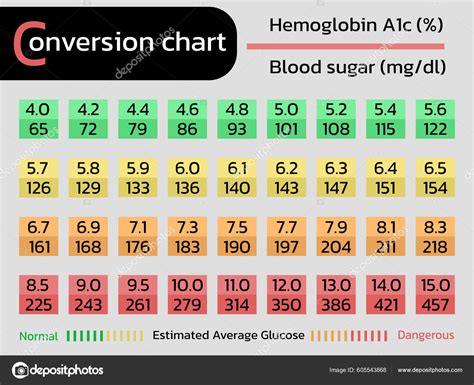
Note: The ADA recommends that adults with diabetes aim for an A1C level of < 7%.
A1C Levels Printable Chart and Tracker

To help you monitor your A1C levels, we have created a printable chart and tracker. This chart allows you to record your A1C levels over time, track changes, and identify patterns.
| Date | A1C Level | Notes |
|---|---|---|
| _______ | _______ | _______ |
| _______ | _______ | _______ |
| _______ | _______ | _______ |
Instructions:
- Record your A1C level and date in the chart.
- Use the notes column to track any changes in your treatment plan, medications, or lifestyle.
- Review your chart regularly to identify patterns and trends in your A1C levels.
Managing A1C Levels
To manage your A1C levels, follow these tips:
- Monitor blood sugar levels regularly: Use a glucometer to track your blood sugar levels throughout the day.
- Take medications as prescribed: Adhere to your medication regimen to maintain optimal blood sugar control.
- Maintain a healthy diet: Focus on whole, unprocessed foods, such as vegetables, fruits, whole grains, and lean proteins.
- Stay physically active: Engage in regular physical activity, such as walking, to improve insulin sensitivity.
- Get enough sleep: Aim for 7-8 hours of sleep per night to help regulate blood sugar levels.
📝 Note: Consult with your healthcare provider to develop a personalized plan to manage your A1C levels.
Conclusion
A1C levels are a critical metric for managing diabetes. By understanding how to interpret A1C levels, using a printable chart and tracker, and implementing effective management strategies, you can achieve optimal blood sugar control and reduce the risk of diabetes-related complications.
What is a normal A1C level?
+
A normal A1C level is < 5.7%.
How often should I check my A1C levels?

+
The American Diabetes Association recommends checking A1C levels at least twice a year, or more often if you’re not meeting your treatment goals.
Can I use an A1C chart to track my levels?
+
Yes, an A1C chart can be a helpful tool to track your levels over time and identify patterns and trends.


